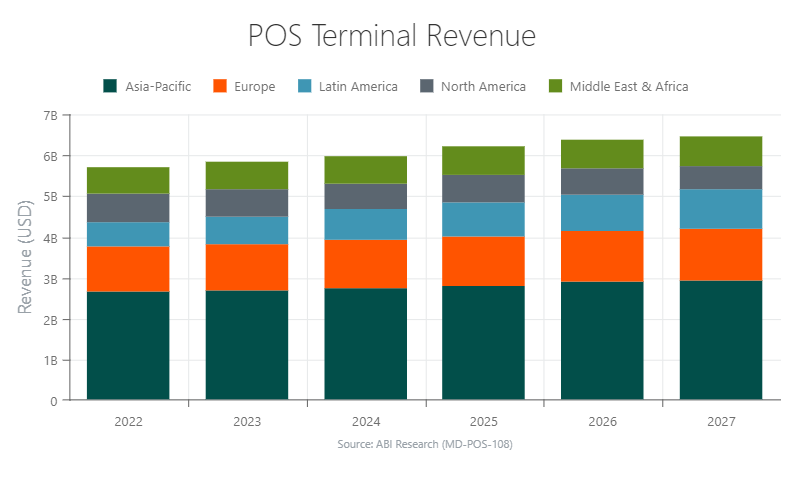
In the wake of the COVID-19 pandemic, consumers are shopping in person again at brick-and-mortar stores. The growth of in-store shopping means retailers, restauranters, and other shopping locations require more Point of Sale (POS) terminals to complete digital transactions, particularly through contactless solutions. ABI Research’s latest POS and mPOS Devices market data backs this claim up, reporting a +2.4% Year-over-Year (YoY) shipment growth for POS terminals in 2022, and expecting a further +3.8% YoY growth in 2023. The POS market size is worth US$5.84 billion today and will increase to US$6.46 billion in value by 2027.
From regional outlooks to the growing shift to Mobile POS (mPOS) systems, several trends are sweeping through the industry.

Types of POS Terminals
Merchants have five traditional types of POS terminals to choose from for a digital payment solution. ABI Research’s market forecasts classify POS payment machines into the following five categories:
- Countertop: When you think of checking out at a store, it’s typically done at a traditional POS terminal, which has a fixed location. These systems are called countertop terminals, supporting receipt printing capabilities, and are usually wired.
- Personal Identification Number Pad (PINPad): A PINPad payment solution can either be low-end (requiring a connection to a countertop solution) or high-end (standalone solution). While the former requires support from another device, the latter is more intelligent, thus is can process payments by itself.
- Portable: A portable POS terminal is essentially a traditional terminal that allows the merchant to complete a transaction anytime and anywhere. These fully wireless (General Packet Radio Service (GPRS), Bluetooth, and Wi-Fi) battery-powered devices are ideal for scenarios where the risk of damage to the POS system is high. For example, in restaurants or hotels—where drops and spills can easily occur—or transit and outdoor retail that require multiple wireless connectivity options.
- Mobile POS (mPOS): In reference to mPOS solutions, we are talking about mPOS devices that necessitate a connection with other mobile devices, such as a smartphone, tablet, or Personal Digital Assistant (PDA). The mPOS device can have card swiping, chip reading, or contactless payment capabilities. Moreover, connectivity is done either through Bluetooth, an audio jack/charger, or sometimes Near Field Communication (NFC).
- Others: Other POS systems consist primarily of multilane retail terminals and smart POS terminals. Multilane retail terminals are designed for the most demanding retail environments, accelerating checkout and improving consumer engagement via multi-media capabilities (e.g., self-checkout, on-screen instructions and promotions, etc.). Smart POS devices are an emerging area, typically being an all-in-one terminal encompassing shared or dual-screen capabilities for merchant and consumer-facing applications. These types of POS terminals will most likely leverage top-tier chipsets and Operating Systems (OSs) to support both fixed and portable payment processing capabilities.
Recent POS Market Trends
COVID-19 was a blessing and a curse for the POS market. On the one hand, it resulted in lockdowns, which prevented in-store shopping. But the pandemic also gave rise to the mainstay of contactless and mobile payments due to public safety concerns. Cash-based transactions went down, which is a trend that is here to stay. This has translated into banks increasing contactless transaction limits, which will continue to sustain within the industry. Ultimately, these new shopping norms necessitate greater demand for POS payment machines.
Despite pandemic-related challenges, ABI Research reported a +5.6% YoY POS terminal shipment growth in 2020, and +4.7% in 2021. Moreover, the global installed base for the POS terminal market rose by +5.9% and +5.3% in those same 2 years. The year 2022 saw the installed base increase a further +5.1%, and 2023 will see another +4.6% YoY growth. The story behind all these market forecasts is that the POS market remained resilient during the COVID-19 pandemic, when many other industries suffered.
Another hot topic in the POS market has been the chip shortage, and how it impacts vendors across the industry supply chain. While the chipset shortage is beginning to ease, thanks to increased capacity, Average Selling Prices (ASPs) are not expected to return to pre-COVID-19 levels anytime soon. As a result of the increased chipset prices, POS vendors have passed the higher costs onto their customer bases. As foundries prioritize clients with higher margins, the industry can expect these higher APSs to be the new baseline.
Analysis of Regional POS Markets
Below is a summary of POS terminal shipments in all the major regional markets.
- Asia-Pacific: The Asia-Pacific region dominates the POS market, accounting for 54.7% (101.51 million terminals) of the global POS terminal installed base. Unlike some of the other regions, Asia-Pacific did not experience any POS sales declines within the last 4 years. The year 2023 will see a +4.1% YoY growth in shipments over 2022. Overall shipments in the Asia-Pacific region dwarf that of other regions, totaling 32.56 million annually by 2027, and growing at a Compound Annual Growth Rate (CAGR) of 2.1%.
- Europe: POS terminal shipments were down -7.1% YoY in 2022 in Europe, but will rebound with a +0.6% YoY growth this year. Then, the year 2024 will result in a +7.4% growth in POS systems. Between 2022 and 2027, ABI Research forecasts a CAGR of 3.5% in Europe, surpassing 6 million annual shipments by 2027.
- Latin America: After a tough year in 2019 (-10.1% YoY), POS terminal shipments in Latin America were up +7.3%, +17.7%, and +13.4% in 2020, 2021, and 2022, respectively. The future outlook of the market looks bright, growing at a CAGR of 9.6% through 2027, reaching 6.56 million annual shipments by the end of the forecast window.
- North America: POS terminal shipments have been down for 2 consecutive years in the North American market (-2.2% in 2021 and -12.4% in 2022), driven primarily by the nature of replacement cycles. Generally speaking, the region will experience a CAGR of -0.4% between 2022 and 2027, with 2025 being the only solid year for POS sales growth (+5.7%) due to the next significant replacement cycle kicking in. Annual POS terminal shipments are anticipated to reach 4.26 million in 2027, which is down from the region’s peak in 2020 (5.09 million).
- Middle East & Africa: POS terminal shipment growth has been robust in the Middle East & Africa region since 2019. The region experienced +17.6%, +16.8%, and +30.4% YoY shipment growth in 2019, 2020, and 2021, respectively, before dropping off to +7.6% in 2022 and +1.9% in 2023. ABI Research expects a +2.2% CAGR for POS terminal shipments in the Middle East & Africa between 2022 and 2027, reaching 5.56 million by 2027.
Table 1: POS Terminal Shipments (Millions) and Shipment Market Share by Region
World Markets: 2022 to 2027
(Source: ABI Research)
| Region |
2022 |
2023 |
2024 |
2025 |
2026 |
2027 |
CAGR 22-27 |
2023 Shipment Market Share |
| Asia-Pacific |
29.28 |
30.49 |
31.06 |
31.66 |
32.13 |
32.56 |
2.1% |
61.4% |
| Europe |
5.10 |
5.13 |
5.51 |
5.73 |
5.89 |
6.06 |
3.5% |
10.3% |
| Latin America |
4.14 |
4.63 |
5.11 |
5.59 |
6.08 |
6.56 |
9.6% |
9.3% |
| North America |
4.35 |
4.37 |
4.29 |
4.54 |
4.45 |
4.26 |
-0.4% |
8.8% |
| Middle East & Africa |
4.98 |
5.07 |
4.95 |
5.14 |
5.35 |
5.56 |
2.2% |
10.2% |
| Total |
47.86 |
49.70 |
50.93 |
52.66 |
53.90 |
55 |
2.8% |
- |
| YoY Growth |
2.4% |
3.8% |
2.5% |
3.4% |
2.4% |
2% |
- |
- |
While the Asia-Pacific region has the highest installed base and shipment totals for the POS terminal market, it’s important to point out its relatively low installed base per 1,000 capita. This number hovers around 24 POS terminals per 1,000 citizens, which is the second-lowest out of all the regions (the Middle East & Africa have just 11.01 terminals per 1,000 capita by 2027). This figure is a far cry from the North American (51.57 by 2027), Latin American (41.58), and European (41.08) averages. A statistic like this highlights the fact that despite a broad perception that digital payments is a mature and saturated market, room for growth is aplenty, provided the correct region is targeted.
POS Terminal Shipments by Product Type
When evaluating the POS market based on product type, mPOS terminals lead the way, constituting about 35% of the shipment market share throughout the forecast period. A full breakdown of POS system shipments by product type can be found in Table 2.
Table 2: POS Terminal Shipments (Millions) and Shipment Market Share by Product Type
World Markets: 2022 to 2027 (Source: ABI Research)
| Product Type |
2022 |
2023 |
2024 |
2025 |
2026 |
2027 |
CAGR 22-27 |
2023 Shipment Market Share |
| Countertop |
11.53 |
11.54 |
11.46 |
11.39 |
11.33 |
11.17 |
-0.6% |
23.2% |
| PINPad |
6.37 |
6.50 |
6.62 |
6.67 |
6.62 |
6.65 |
0.9% |
13.1% |
| Portable |
11.63 |
12.29 |
13.01 |
13.75 |
14.27 |
15 |
5.2% |
24.7% |
| mPOS |
16.50 |
17.45 |
17.80 |
18.34 |
18.90 |
19.42 |
3.3% |
35.1% |
| Others |
1.83 |
1.91 |
2.05 |
2.51 |
2.78 |
2.76 |
8.6% |
3.9% |
| Total |
47.86 |
49.70 |
50.93 |
52.66 |
53.90 |
55 |
2.8% |
- |
The Rise of the mPOS Terminal
Better mobility in digital payment solutions is one of the biggest trends shaping the POS market. This is due to businesses adapting to consumer behavior, particularly Small and Medium Businesses (SMBs), which continue to grow their digital payment acceptance capabilities within areas that include hospitality, where service and mobility are key market attributes. Therefore, ABI Research expects mPOS terminal shipments to grow from 16.5 million in 2022 to 19.42 million in 2027. Meanwhile, portable device shipments will grow from 11.63 million in 2022 to 15 million in 2027. The mPOS installed base will grow from 57 million to 77 million in that same time span.
Although the forecast looks bright for the mobile POS market, Apple could potentially monopolize the industry via Apple Pay. The tech giant’s enablement of contactless transaction acceptance on a host of its devices could halt new mPOS sales growth in select regions in the short term and other regions in the long term. Apple’s mPOS ambitions mean that a separate mPOS device will not be needed for payment processing.
This trend will primarily impact smaller merchants that may be allured by the cost-effective idea of using the Bring-Your-Own-Device (BYOD) solution for payments. As evidence of the ripple effects of this POS market trend, Block (formerly called Square) shares dropped -3.6% after Apple’s mobile payments service was announced. However, once Block announced its partnership with Apple, its stock shot back up 7%.
Summarizing the POS Market
In conclusion, the POS terminal market is in a healthy state, with the global installed base expected to grow at least 3% every year through 2027. By then, the POS installed base will be more than 212 million worldwide, with the Asia-Pacific region accounting for more than half of that figure.
POS terminal solution providers have huge opportunities presented in front of them as retailers, governments, financial services firms, and consumers find consensus in the need for a greater variety of payment solutions, especially with infection containment weighing heavily on their minds.
While countertop POS terminals once dominated the POS market, those days are over, with their market share shrinking yearly. Mobile payment options, particularly mPOS devices, are the future as they provide flexibility and safety for the consumer, as well as convenience for small business merchants and an improved customer experience for all business sizes.
You can learn more about the latest technology trends and demand forecasts for the POS market by downloading ABI Research’s POS and mPOS Devices market data report. This content is part of our Digital Payment Technologies Research Service.