
In 2019, the micromobility industry (shared scooters, bicycles, and mopeds) saw a healthy spike, but with the COVID-19 pandemic, adoption was negatively affected. However, forecasts are optimistic yet again, with some markets experiencing a 240% increase in ridership. Due to higher gas prices, many people are seeking new means of transportation. Moreover, last-mile delivery, which often makes use of scooters and bicycles, is an ever-growing industry. By 2027, ABI Research expects the shared micromobility vehicle installed base to reach nearly 45 million and to be an almost US$9 billion market opportunity.
Micromobility Companies Are Still Trying to Find the Right Business Model
After raising public awareness and obtaining city permits, all too many companies in the micromobility services industry make a common mistake: they forget to develop a sound business model. For example, many companies have wasted their investor-backed money on diversifying their fleets in regions where certain types of vehicles are not even popular. For instance, e-bicycles are not currently a prominent preference among North Americans and Europeans. By failing to understand the customer, companies end up with far more supply than needed—and dwindling profit margins. This mistake translates into the unfortunate scenario of mass layoffs.
The following outlines several business models that micromobility companies are using:
- Traditional Business Model: The company charges between US$0.10 and US$0.35 per minute plus a US$1 to US$3 one-off unlocking fee. To increase usage and customer loyalty, some companies offer lower-priced daily and monthly passes or offer discounts to frequent/long-distance riders.
- Advertising and Gamification-Led Revenue Model: Customers gain free time riding if they watch an advertisement before and after a ride and pay a small fee (around US$0.15) for every minute after. In gamification models, riders accumulate rewards over time, such as “TreeCoins” that can be used for micromobility services from HumanForest. For more ideas on incentive-based promotion, Canadian-based micromobility platform Joyride has some solid advice in a recent blog post.
- Automatic Dynamic Pricing: Similar to Uber, the company dynamically prices the cost to rent an e-scooter, e-bikes, or moped based on demand. So, if an area of a city has high demand, then the price can be increased. Automatic pricing can also extend to socioeconomic conditions. To illustrate, prices can be decreased in low-income areas.
- Diversification: The stagnated sales caused by the COVID-19 pandemic forced companies to seek new revenue streams, with last-mile delivery services being chief among them. Last-mile delivery is an enormous industry in places like India and Brazil, where people needed an income after losing their jobs during the pandemic. Companies like Yulu, Tembici, and Bounce are taking advantage of this trend.
- Outsourcing: To save on operational costs, a number of players delegate charging and rebalancing (i.e., redistribution, pickup, drop-off) duties to registered app users in exchange for US$5 to US$12 per action. Ride sharing company Bird turned its -77% average trip margins to 16% after introducing its outsourcing operating model Fleet Manager.
Placing the Fleet in the Right Place at the Right Time
Just like how taxis line up outside of an airport to promote visibility, shared micromobility operators must deploy their vehicles in areas that will result in the greatest visibility—and subsequent adoption. Unfortunately, it’s not as easy as the taxi driver scenario. Logic would tell you to simply set up shop in the most densely populated areas of the city to generate considerable attention. However, this plan rarely works because a high population does not inevitably lead to high demand. To achieve high vehicle utilization, companies must take a data-driven approach.
- Predictive Rebalancing: Fleet management platforms leverage Machine Learning (ML) and Artificial Intelligence (AI) prediction algorithms, which consider both real-time and historical data of vehicles—then automatically move the correct types of vehicles to the most optimal locations within the fleet. Besides vehicle location data, cloud-based fleet management platforms automate vehicle rebalancing and relay the changes to drivers and field agents based on utilization rate, predictive demand algorithms, vehicle preferences (i.e., most popular vehicle type in a specific location), vehicle health, and battery life remaining.
- Downtime Reduction: Through automation, micromobility companies can identify, collect, and repair damaged/broken vehicles in a way that doesn’t negatively affect vehicle availability. For example, a field agent might want to recharge an e-bicycle that’s at a 20% charge in a high-demand area.
- Operations Launch: When planning for a commercial launch in a city, a micromobility company can look to myriad indicators, such as public transport infrastructure and routes/schedules, competition, socio-economic factors (e.g., car ownership, education level, etc.), contextual and seasonal factors (e.g., weather, tourism), demographics, land use, and local population behavior. In conjunction with AI algorithms, these data can inform you about the nature of ride-sharing trips in a particular location (e.g., frequency, duration, etc.) and how much revenue to expect.
Get the Report: Improving Efficiency and Profitability of Shared Micromobility Operators
Addressing Micromobility Safety Concerns
When it comes to micromobility services, vehicle safety is a contentious topic in many cities, as bicycles, scooters, and mopeds are often involved in serious accidents. Moreover, safety is a deciding factor for many potential customers. In addition to the lack of proper infrastructure (e.g., dedicated lanes, dedicated parking spaces), unsafe driver behavior is a culprit in the prevalence of accidents. Until micromobility companies can effectively demonstrate that their services are safe, cities won’t bother investing in the infrastructure. Therefore, the focus right now is on implementing micromobility fleet systems that can identify and even thwart unsafe user behavior.
- In-House Manufacturing and Design: Although production costs may be higher, in-house manufacturing is the path to safe riding and winning city tenders. That’s why safety-focused companies like Superpedestrian and Neuron manufacture their own vehicles. As a happy medium, some players choose to design their vehicles in-house and outsource manufacturing.
- Geofencing: Already popular in sustainable cities, geofencing can ensure that micro-mobile vehicles automatically slow down in high-pedestrian areas like a city intersection or around a hospital. Geofencing can also enable operators to charge a penalty fee to users who park outside the defined zone. In other cases, a user may enter a restricted zone where the scooter will come to a stop and the vehicle must be walked out of the zone before being usable again.
- Preventing Unsafe E-Scooter Behavior: Before going mainstream, the shared micromobility industry must find ways to prevent the following unsafe user behaviors: erratic swerving, wrong-way riding, improper parking, hard breaking, stop sign violations, alcohol consumption, stunt driving, and other dangerous actions. Some technologies that can address these safety concerns include standalone cameras equipped with computer vision algorithms, integrated sensor fusion, and onboard computing.
Micromobility Safety Case Study #1: Superpedestrian’s Pedestrian Defense
Superpedestrian’s Pedestrian Defense is an active safety system that can detect risky driving maneuvers and executes preventative actions. Not only does the system provide post-ride alerts to users about safety guidelines, but data from the ride can also be accessed by stakeholders. This information lets cities track micromobility safety Key Performance Indicators (KPIs) and make better decisions when it comes to geofencing criteria, investments, and policy.
Micromobility Safety Case Study #2: Luna
Urban mobility platform Luna offers a camera-based solution that successfully identifies sidewalks, pedestrians, and road infrastructure. Using AI and computer vision, Luna can detect unsafe driver behavior 95% of the time. When a driver enters an unrestricted area, Luna emits a beep to notify the driver. Further, the Luna system allows operators to slow down or stop a scooter in real time. Finally, Luna is tackling poor parking with its AI Parking Selfie Software-as-a-System (SaaS) solution that uses visual indicators (painted markings) to ensure compliant parking.
Complying with City Requirements and Regulation
Unlike early ridesharing companies like Uber, micromobility players have been met head-on with swift enforcement from city governments. For example, in 2021, Oslo limited the number of available scooters for rental to 8,000—even though there was a demand for 25,000 scooters. This resulted in the elimination of 9 out of the 12 micromobility operators in the city.
And in Sweden, companies are mandated to install a keypad and a printer on a shared bicycle to accommodate the very few users that may not have a smartphone. A major influence on restrictive measures like this comes down to safety and nuisance. As a first step, governments have imposed some of the following policies to overcome concerns about public safety and clutter:
- No-riding zones (geofencing)
- Helmet wearing
- Maximum fleet size
- Requiring a permit for parking stations
- Requiring a driver’s license
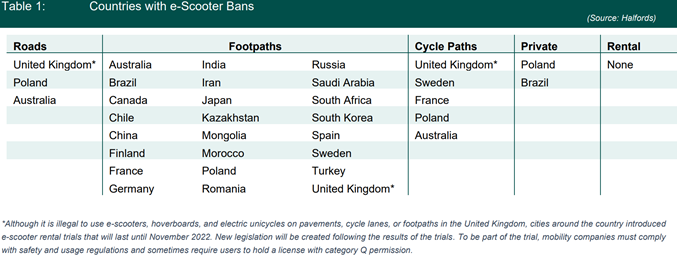
- Banning the use of vehicles on public roads, sidewalks, or cycle paths
- Relocation of parking spaces from cars to two-wheel vehicles
Table 1: Countries That Have Bans on Electric Scooters
How to Find Favor from Authorities
To take back the narrative and remove negative stereotypes, micromobility firms need to demonstrate the benefits of their fleet services. Authorities are more likely to provide permits to companies that can show how their fleets benefit citizens and the community as a whole (e.g., air quality, traffic congestion, urban landscape) and can accurately predict demand. This makes fleet management and data analytics companies like Anadue, Otonomo, and Autofleet highly attractive, as their products accurately measure impact. For example, the Autofleet platform enables operators to carry out simulations with their fleets to decide when, where, and at what price vehicles should be charged. In turn, this reduces downtime. Besides becoming aware of the advantages of shared micromobility, city officials can also be more confident in modifying the urban design in the safest and most hassle-free way (e.g., parking spaces and dedicated lanes).
What Kind of Demand Can We Expect for the Micromobility Market?
The following sections compile regional forecasts from ABI Research in the micromobility market.
Asia-Pacific
Asia has dominated and will continue to dominate the shared micromobility vehicle market. In 2021, the Asia-Pacific region accounted for 15 million of the 16.9 million total installed base. In 2027, the region will have an installed base of 37.4 million out of the 44.8 million global installed base and grow at a Compound Annual Growth Rate (CAGR) of 16.4%. By far, bicycles are the most popular form of shared micromobility in Asia.
Europe and North America
Europe and North America will witness steady growth, albeit far less impressive than Asia-Pacific. In 2021, Europe and North America had micromobility installed bases of 968,211 and 854,600, respectively. By 2027, those numbers will balloon to 3.8 million and 3.2 million, at CAGRs of 25% each. While bikes are the predominant vehicle in Europe and North America, the prevalence of electric scooters on the two continents (4.3 million by 2027) is more than 4X higher than the rest of the world combined.
Mopeds are very common in Europe, less so in North America. The installed base of shared mopeds in Europe (392,265 by 2027) will be nearly on par with the entirety of Asia-Pacific (402,576 by 2027). Meanwhile, just 54,720 shared mopeds will be used in North America in 2027.
Latin America
In Latin America, Brazil will account for 33% of the bike-sharing services within the region. In total, the installed base will grow at a CAGR of 32% between 2021 and 2027—coming to a total of 310,646 by the end of the forecast period. Like in Asia-Pacific, bicycles account for the overwhelming majority of shared mobility in Latin America. Further, electrification will not take off in a meaningful way, as only 4% of all shared bikes will be electric.
Electrification Trends
While traditional two-wheeler vehicles far outweigh the shared mobility installed base of electrified versions, the latter will experience tremendous growth in the coming years. By 2027, there will be 4.8 million shared electric bikes in circulation, a huge gain over the 982,295 vehicles in use in 2021. That’s a CAGR of 30.5%. Meanwhile, the shared electric scooter installed base will reach 5 million by 2027 and grow at a CAGR of 30.7% between 2021 and 2027. In Europe and North America, electric bikes will make up more than half of all shared bikes as early as 2025.
What Does This All Mean?
Clearly, micromobility players can look forward to a growing customer base, especially as consumers look for sustainable modes of transportation. However, a number of roadblocks stand in the way of profitability, such as regulation, high manufacturing costs, safety concerns, and a volatile macroeconomic environment. To learn how to solve these challenges, download ABI Research’s Improving Efficiency and Profitability of Shared Micromobility Operators research report. This research is part of the company’s Smart Mobility & Automotive Research Service.

 Jennie Baker